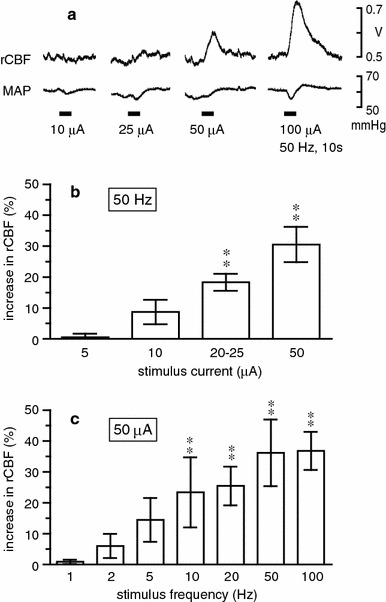
Fig. 4.

Changes in rCBF in the parietal cortex ipsilateral to the stimulated NBM. a Sample recordings of rCBF obtained by laser Doppler flowmetry and mean arterial pressure (MAP) in a mouse. b, c Summarized responses of rCBF measured at maximum level and expressed as the percentage increase from the prestimulus control rCBF. Each column and vertical bar shows the mean ± SEM (n = 8). Data depict blood flow changes measured by laser Doppler (n = 6) or laser speckle (n = 2) flowmetry. **p < 0.01; significantly different from prestimulus control rCBF by one-way repeated-measures ANOVA followed by Dunnett’s multiple comparison test
