
Fig. 2.
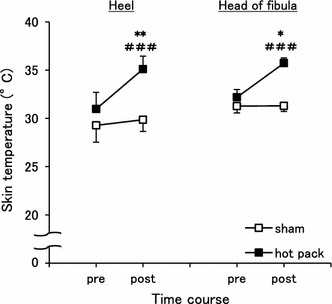
Changes in skin temperature after treatment. The skin temperatures of the right heel (left graph) and the head of fibula (right graph) were significantly increased after the hot pack treatment compared to the sham treatment. *p < 0.05 and **p < 0.01 vs the sham treatment. ### p < 0.001 vs pre within the hot pack treatment