
Fig. 1.
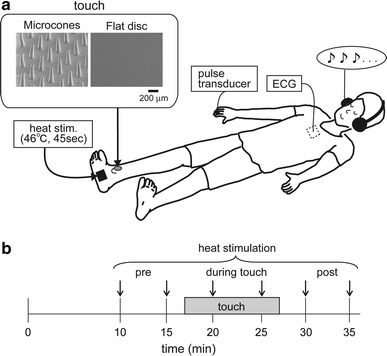
Experimental setting (a) and protocol (b). The frame in the upper left of (a) shows scanning electron microscopic views of the cutaneous stimulation tool surface. The surface was placed on the skin. A horizontal bar located below the right photograph indicates the scale (200 μm) for both pictures (a). Heat stimulation was applied to the plantar foot at a time period indicated by a down arrow (b)