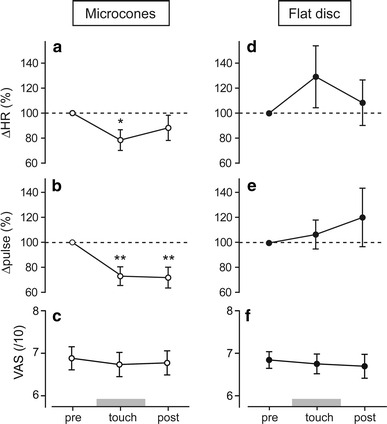
Fig. 4.

Averages of changes in heart rate (ΔHR) (a, d), pulse wave amplitude (Δpulse) (b, e), and visual analog scale (VAS) (c, f) in response to heat stimulation before, during, and after touch with microcones and flat disc, expressed as mean ± standard error of the mean. *p < 0.05, **p < 0.01 versus pre-touch value, tested by one-way repeated measures ANOVA, followed by Dunnett’s multiple comparison test
