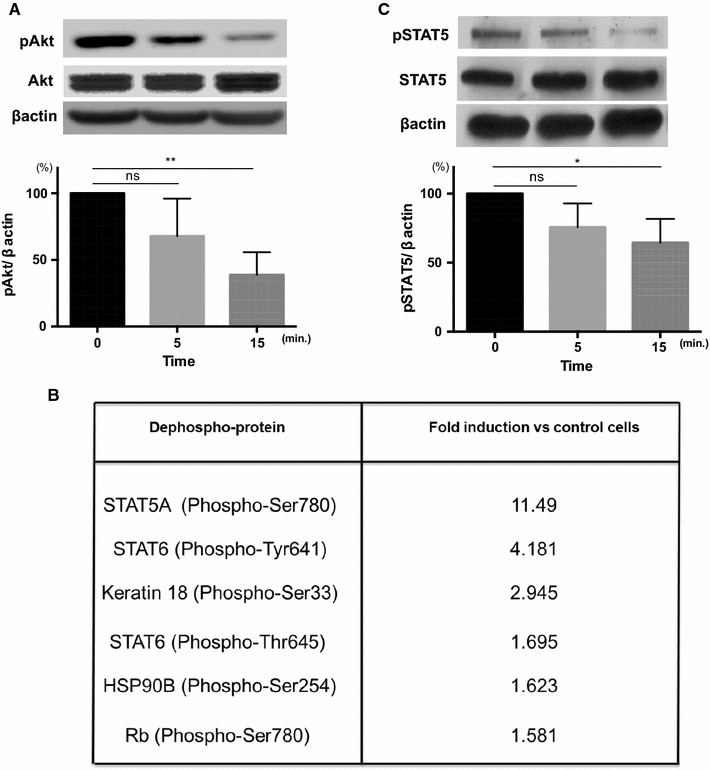
Fig. 4.

Pyr3 inhibits phosphorylation of STAT5 and Akt. a Representative images of Akt phosphorylation are shown. Densitometric analyses (bar graph) of Western blots showed that phosphorylation of Akt was inhibited by TRPC3 inhibitor, Pyr3 (n = 4, **p < 0.01, ns not significant). b Protein phosphorylation microarray analysis in the presence of Pyr3. C8161 cells were incubated with DMSO (vehicle control) or Pyr3 (10 μM) for 15 min. The Y-axis shows the signal ratio of phosphorylated to non-phosphorylated protein in the presence of Pyr3 as a percentage of that of the DMSO control. c Representative images of STAT5 phosphorylation. Densitometric analyses (bar graph) of Western blots showed that phosphorylation of STAT5 was inhibited by Pyr3 (n = 4, *p < 0.05, ns not significant)
