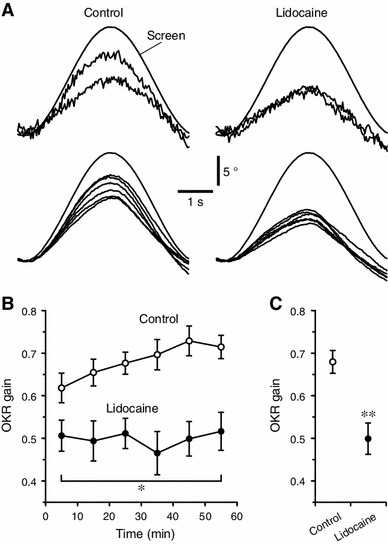
Fig. 4.

Practical performances. a–c OKRs of the lidocaine-injected and control mice (n = 6 and 8, respectively). a Sample time-courses of the estimated pupil azimuth of single animals. Upper traces, responses to single screen oscillation obtained in the first and last 10 min periods of a 1 h measurement session. Lower traces, averages of each 10 min period of a 1 h measurement session. Screen, measured relative screen drum azimuth. b Average OKR gains of each 10 min period. Dot and error bars, mean ± SEM. Asterisk, p = 0.043 for time × drug condition interaction compared with the control, repeated measures ANOVA. c Grand mean OKR gains over the whole session. The values are calculated by averaging the data of all the 10 min periods. Double Asterisk, p = 0.0015 compared with the control, multivariate ANOVA
