
Fig. 2.
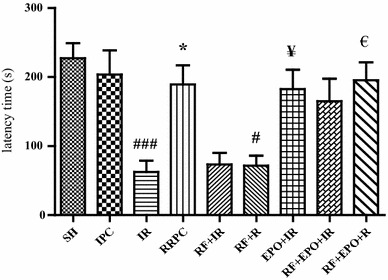
Latency time in passive avoidance test in different groups. The latency was the time spent in crossing from the illuminated compartment (electric shock-free part) to the darkened compartment (shock part) in the retention session (mean ± SE, n = 7). Statistical analysis was done using one-way ANOVA followed by post hoc Tukey test. ### P < 0.001 vs SH group, *P < 0.05 vs I/R group, # P < 0.05 vs RRPC group. ¥ P < 0.05 vs I/R group, € P < 0.05 vs RF + R group