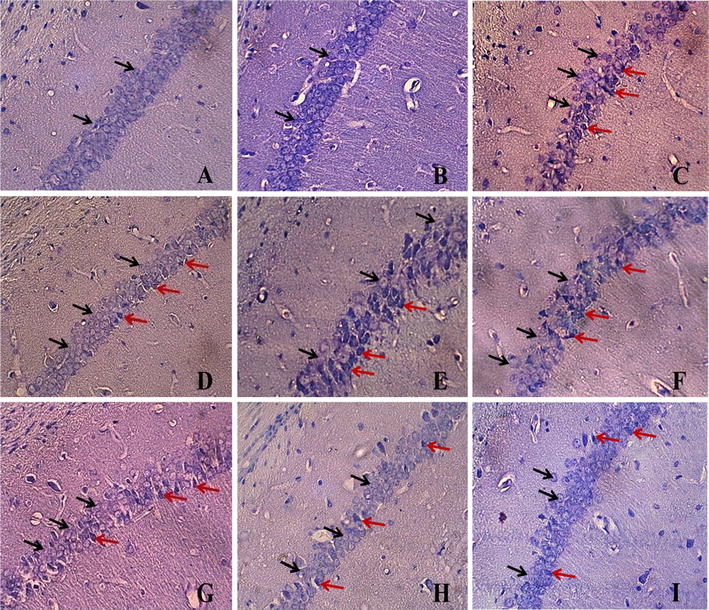
Fig. 3.

Nissl staining of hippocampal CA1 subregion (magnification ×400). a Sham group; b IPC group; c I/R group; d RRPC (IPC + I/R) group; e RF + I/R group; f RF + RRPC group; g EPO + I/R group; h RF + EPO + I/R group; i RF + EPO + R group. Black arrows indicate intact cells and red arrows indicate necrotic cells
