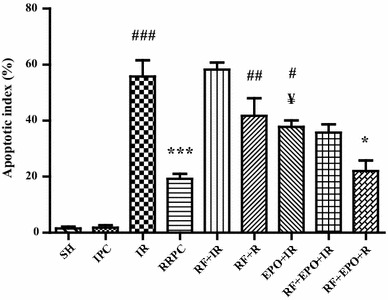
Fig. 6.

The graph shows the percentage of TUNEL-positive cells that was explained as percent of apoptotic cells in each field (mean ± SE, n = 4). Statistical analysis was done using one-way ANOVA followed by post hoc Tukey test. ### P < 0.001 vs SH group; ***P < 0.001 vs I/R group; ## P < 0.01, # P < 0.05 vs RRPC group; ¥ P < 0.05 vs I/R group; *P < 0.05 vs RF + R group
