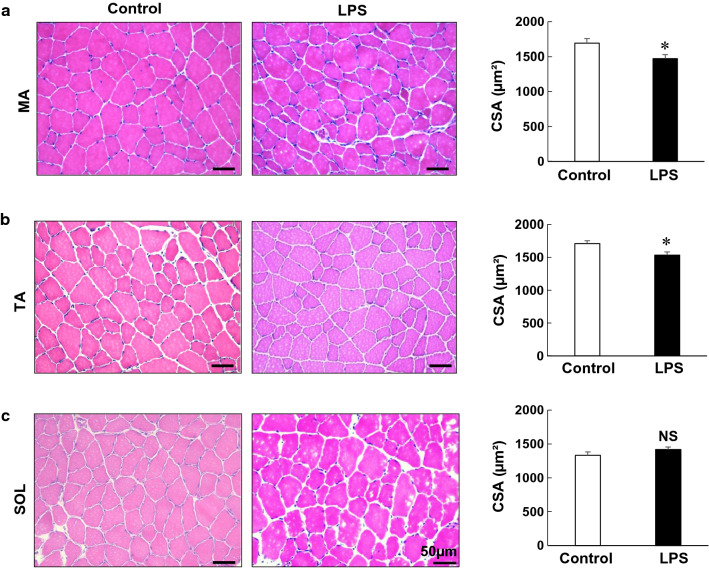
Fig. 2.
Effects of PG-LPS on muscle weight. a–c Typical HE-stained sections of MA (a), TA (b) and SOL (c) muscles in the control (left) and PG-LPS groups (middle), in addition to cross-sectional area (CSA) (right). CSA was significantly decreased by PG-LPS treatment in MA and TA muscles (*P < 0.05 vs control), but it remained unchanged in SOL muscle. Scale bars: 50 μm

