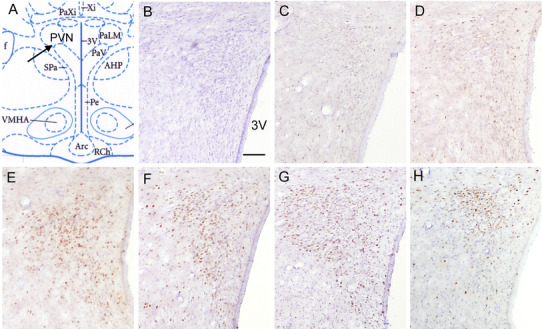
Fig. 2.

Representative sections showing c-Fos expression in the hypothalamic paraventricular nucleus (PVN) induced by different RWIS durations. a The exact location of the PVN. b The specificity of the immunostaining verified by incubation of the brain sections of group 60 rats with normal goat serum. In the control group, there were very few c-Fos-positive neurons in the PVN (c), but there were many remarkable c-Fos-positive neurons in the PVN in groups 30 (d), 60 (e), 120 (f), and 180 (g). h There were fewer c-Fos-positive neurons in group 30-30 than group 60. Scale bars 100 μm. 3V Third ventricle
