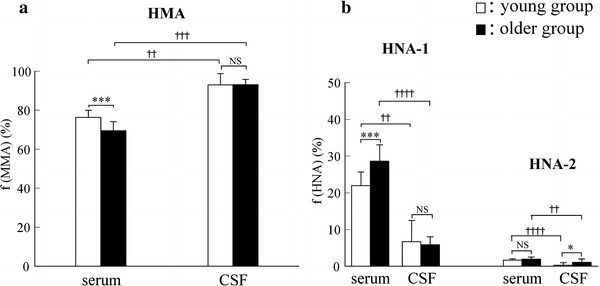
Fig. 2.

Values (%) of a f(HMA) and b f(HNA) (f(HNA-1) and f(HNA-2)) of albumin in serum and CSF from the young group (n = 10, open columns) and older group (n = 32, closed columns). Each column and bar represents the mean value and SD. Mann–Whitney’s U test was used for comparisons between groups (***P < 0.001, *P < 0.05, NS: not significant), and the Wilcoxon signed-rank test was used for comparisons within groups (†††† P < 0.0001, ††† P < 0.001, †† P < 0.01)
