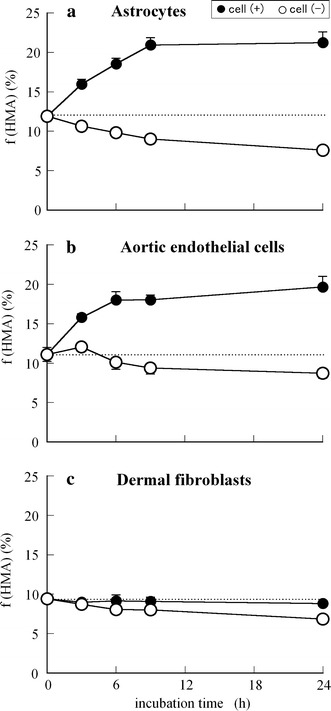
Fig. 3.

Time course of f(HMA) values (%) of HSA incubated at 37°C in each growth medium in the absence (open circles) or presence (closed circles) of cell culture (2 × 10⁵ cells/well): normal human a astrocytes, b aortic endothelial cells, and c dermal fibroblasts. Using independent cell cultures, the data presented are the means ± SE obtained from a representative experiment performed in triplicate
