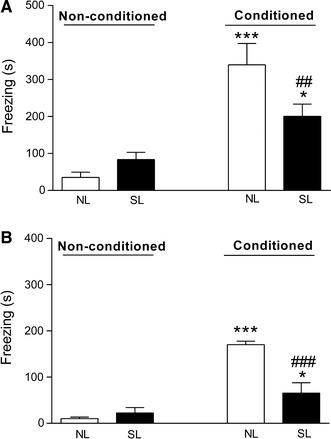
Fig. 5.

Duration of freezing response in the fear conditioning test by male (a) and female (b) offspring from normal litters (NL) and small litters (SL). Data are presented as the mean ± SEM. *p < 0.05; ***p < 0.001 compared to NL/non-conditioned group. ##p < 0.01; ###p < 0.001 compared to NL/conditioned group
