
Fig. 5.
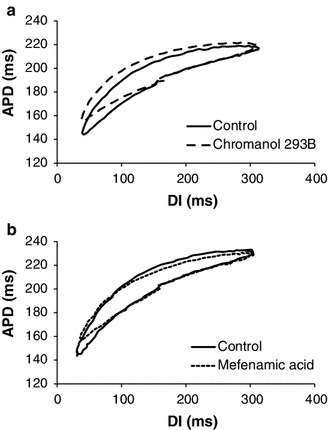
Averaged hysteresis loops (n = 6) during sinusoidal DI protocol with mean DI of 150 ms for control and post-drug data. As in Fig. 4, the curves were vertically shifted to facilitate comparison between the hysteresis loops
Official websites use .gov
A
.gov website belongs to an official
government organization in the United States.
Secure .gov websites use HTTPS
A lock (
) or https:// means you've safely
connected to the .gov website. Share sensitive
information only on official, secure websites.
Averaged hysteresis loops (n = 6) during sinusoidal DI protocol with mean DI of 150 ms for control and post-drug data. As in Fig. 4, the curves were vertically shifted to facilitate comparison between the hysteresis loops