
Fig. 3.
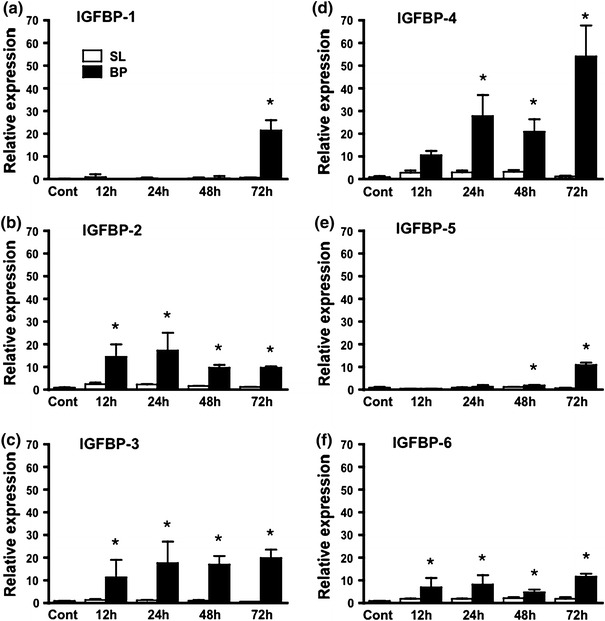
mRNA expression of IGFBP-1 (a), IGFBP-2 (b), IGFBP-3 (c), IGFBP-4 (d), IGFBP-5 (e) and IGFBP-6 (f) after bupivacaine injection. BP bupivacaine-injected muscle, SL saline-injected muscle. Data are presented as the relative values compared to those of the untreated control group (cont). Values are the mean ± SD. Significant differences from cont (*p < 0.05)