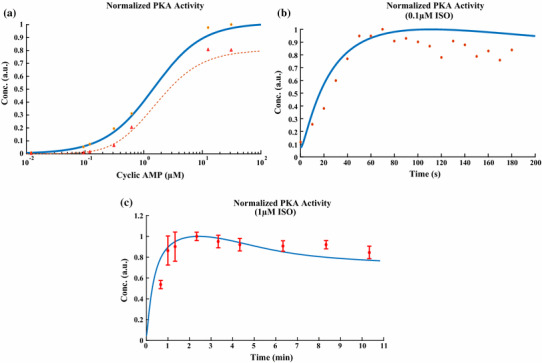
Fig. 6.

The PKA activity after β-ARs stimulation by ISO (a) normalized PKA activity as a function of cAMP level with (simulation dashed line and experimental hollow triangle) and without PKI (1 µM) (simulation solid line and experimental filled circle). The experimental data were obtained from Beavo et al.’s study [5]. b The time course of normalized PKA activity after indicated ISO stimulation. The experimental data were obtained from Amanfu and Saucerman’s study [2] for cardiac myocytes. In a and b, no error bar was provided for experimental data in references. c The time course of normalized PKA activity after indicated ISO stimulation. The experimental data were obtained from De Arcangelis et al.’s study [18] for cardiac myocytes and are mean ± SE from three separate experiments
