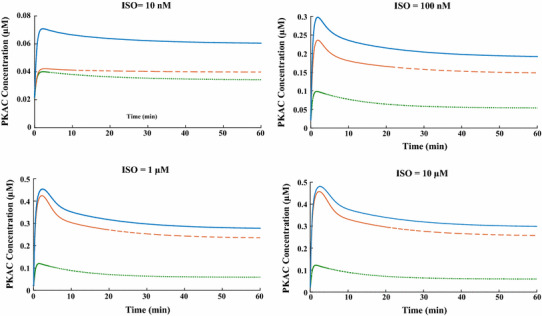
Fig. 7.

The simulated PKA activity after different indicated ISO stimulation. Simulated time courses of PKAc concentration for control condition (normal cardiomyocytes), selective β1-AR and β2-AR stimulation are shown by solid, dashed, and dotted lines, respectively
