
Fig. 2.
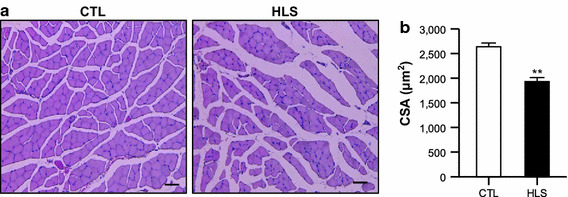
Cross-sectional area (CSA) of soleus muscle of HLS mice at 2 weeks of treatment and CTL mice. a Representative hematoxylin–eosin staining of soleus muscle from a CTL (left) and HLS mouse (right). b Average fiber CSA were measured in the stained soleus muscles (n = 4). Values are presented as the mean ± SE. Double asterisk indicates a significant difference between HLS and CTL mice at p < 0.01. Scale bar 100 µm