
Fig. 5.
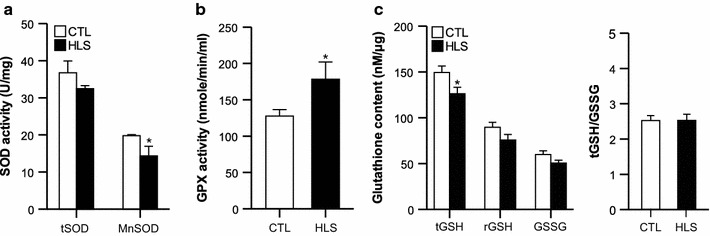
The activities of antioxidant enzymes in HLS mice after 2 weeks of treatment and CTL mice. a SOD activity, b GPX activity, c glutathione content (n = 5 for CTL, n = 6 for HLS group). tSOD total SOD, tGSH total GSH, rGSH reduced GSH. Values are presented as the mean ± standard error (SE). Asterisk indicates a significant difference between HLS and CTL mice at p < 0.05