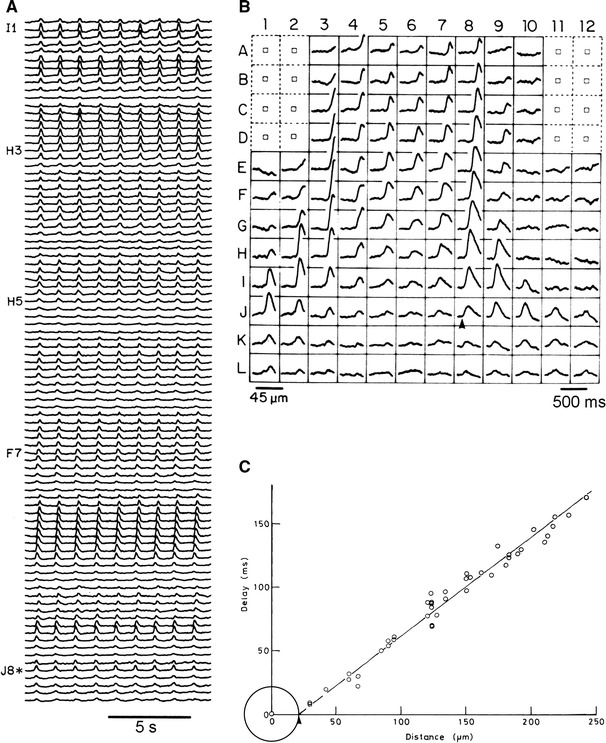
Fig. 3.

a Simultaneous optical recording of spontaneous action potential from 91 contiguous regions of a 9-somite embryonic precontractile chick heart, using a 12 × 12-element photodiode array. The preparation was stained with a merocyanine–rhodanine dye (NK2761), and each trace shows changes in transmission detected by one element at 36.6–37.5 °C. A 702 ± 13 nm interference filter was used. b Real-time optical recording of spontaneous action potentials from a 9-somite embryonic heart, using 128 photodiodes. This preparation was the same as that shown in a. Note the delays in the timing among the signals. The trace of the earliest signal(s) are indicated by an asterisk in a and by an arrowhead in b (position J8). c An example of graphical micro-survey method. The delays in the feet of the signals between the position of the first firing and other positions in which each signal was detected were plotted against the distance between the center of the first firing position and that of other positions. The circle on the origin with a radius of 21 μm shows the size of the pacemaking area of this preparation. Modified from Ref. [14]
