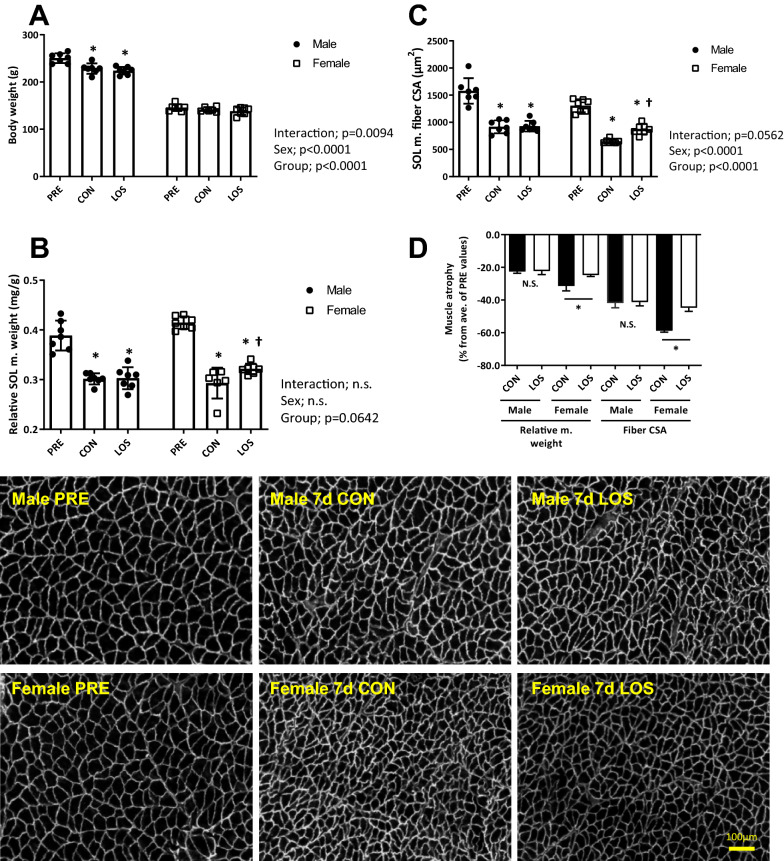
Fig. 1.
Body weight and soleus muscle phenotype. Body weight (a), soleus muscle weight relative to body weight (b), muscle fiber cross-sectional area (c), and dystrophin staining of rat soleus muscle sections (scale bar = 100 μm) and percent change of atrophy relative to untreated controls (d) after 7 days of hindlimb unloading. CON, control; LOS, losartan. Samples were collected 7 days after hindlimb unloading. Values are presented as mean ± standard deviation; n = 7 per time point. The data were analyzed using two-way ANOVA. *P < 0.05 vs. PRE and †P < 0.05 vs. CON of each sex

