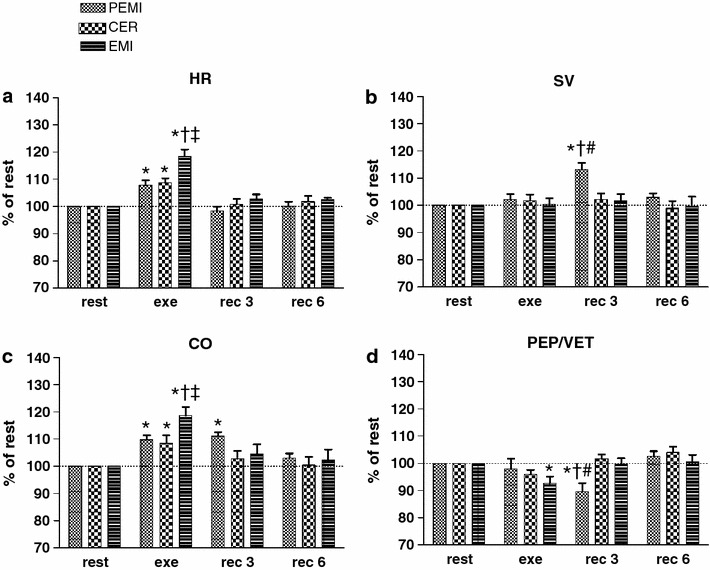
Fig. 1.

Time courses of heart rate (HR, a), stroke volume (SV, b), cardiac output (CO, c), and the inverse of myocardial contractility (PEP/VET, d) during rest, exercise, and recovery in all protocol sessions. Horizontal dashed lines identify the variables’ resting levels. Values are mean ± SEM percentage changes from the corresponding rest values. *p < 0.05 versus rest; † p < 0.05 versus CER test; ‡ p < 0.05 versus PEMI test; # p < 0.05 versus EMI test
