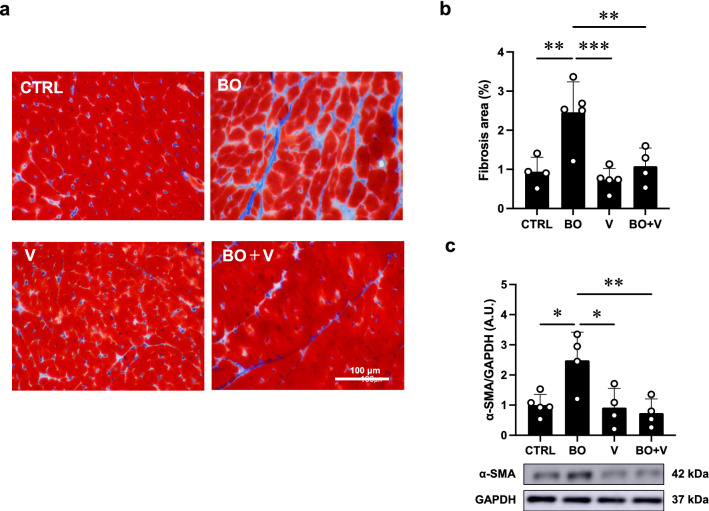
Fig. 2.
Effect of vidarabine on BO-induced fibrosis in the heart. a Representative images of Masson-trichrome-stained sections of cardiac muscle in the Control (CTRL) (upper left), BO (upper right), vidarabine (V) (lower left) and BO + V; lower right) groups. b The area of fibrosis was significantly increased in the BO group (n = 5), but this increase was blocked in the BO + V group (n = 4). **P < 0.01, ***P < 0.001 by one-way repeated-measures ANOVA followed by the Tukey–Kramer post hoc test. c Expression of α-SMA, a fibrosis-related gene, was significantly increased in the BO group (n = 4), but this increase was blocked in the BO + V group (n = 4). *P < 0.05, **P < 0.01 by one-way ANOVA followed by the Tukey–Kramer post hoc test. Data are presented as mean ± SD. Full-size images of immunoblots are presented in Additional file 1: Fig. S3

