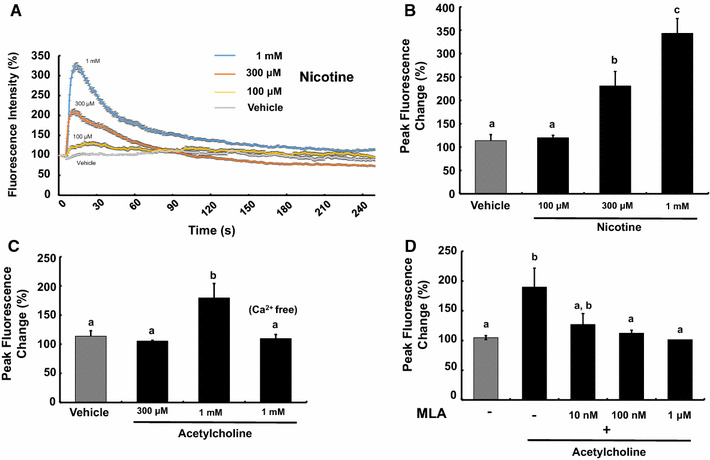
Fig. 3.

Nicotine- and acetylcholine-induced [Ca2+]i increase in GT1-7 cells. a Representative traces of intracellular calcium measured as Fluo-4 fluorescence with different concentrations (100–1000 μM) of nicotine. GT1-7 cells showed [Ca2+]i increase in response to nicotine. b Effects of nicotine on the peak fluorescence changes of the Ca2+ indicator in GT1-7 cells. c Effects of acetylcholine on the peak fluorescence changes of the Ca2+ indicator in GT1-7 cells. d Inhibitory effects of MLA on the peak fluorescence changes of the Ca2+ indicator induced by acetylcholine in GT1-7 cells. The different letters on the columns indicate statistically significant differences (p < 0.05). The data are represented as the mean ± SEM obtained from four separately prepared samples
