
Fig. 4.
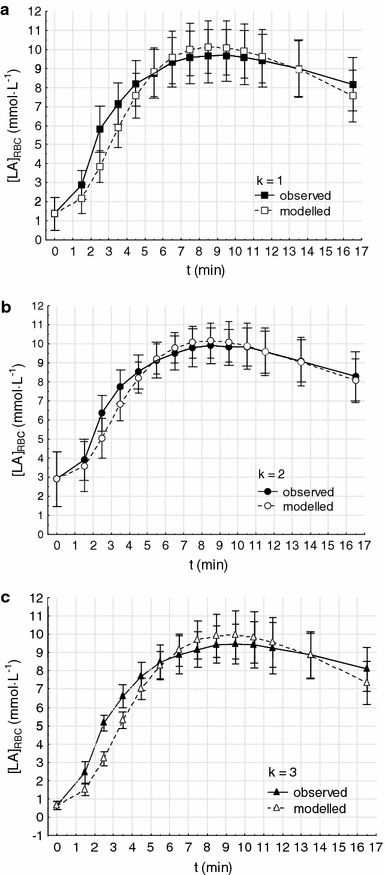
Observed (solid lines with solid symbols) and model-predicted (dashed lines with hollow symbols) lactate concentrations in red blood cells, given in mean ± standard deviation, for (a) k = 1, (b) k = 2 and (c) k = 3. k = 1, Moderate warm-up; k = 2, intensive warm-up; k = 3, without warm-up