
Fig. 4.
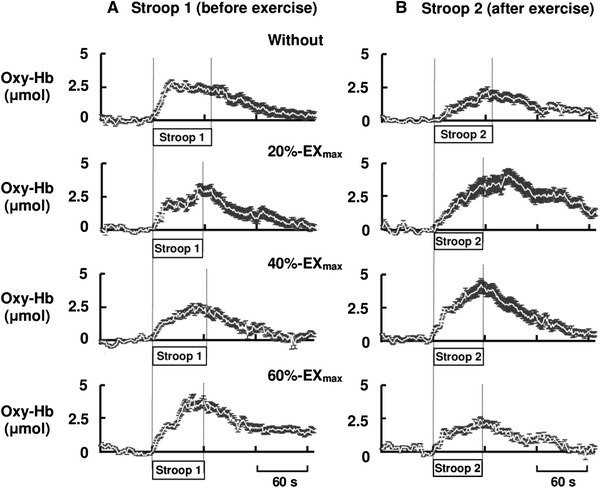
The time courses of the average responses in the left prefrontal Oxy-Hb during the Stroop 1 (before exercise) and the Stroop 2 (after exercise) in 7 subjects. The baseline levels before the Stroop 1 or before Stroop 2 were set to zero. The data were taken every 1 s