Fig. 1.

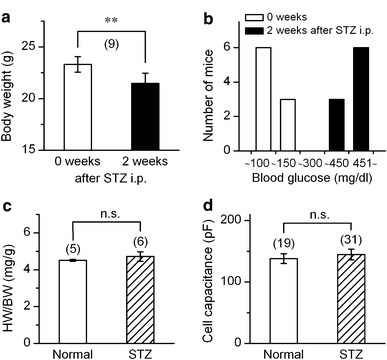
General characteristics of STZ-induced mice. a Mean data showing body-weight of mice measured before (0 week) and 2 weeks after STZ treatment. **Significantly different with P < 0.01 according to a paired t-test. b Distribution of blood glucose level (mg dl−1) among the normal control mice (0 week) and those treated with STZ (2 weeks). c and d comparison of the ratio of heart-weight and body-weight (c), and the cell capacitance of ventricular myocyte (d). Cells were obtained from the mice 2 weeks after STZ treatment (STZ) or from the age-matched un-treated mice (normal). Number in parentheses indicates number of animals (a and c) or number of cells examined (d). n.s., no significant difference
