Fig. 4.

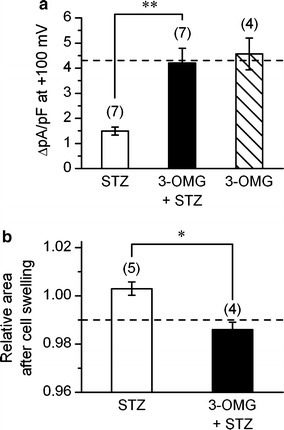
Prevention by 3-OMG of STZ-induced suppression of cardiac VRAC current. a and b Mean density of VRAC current (difference current) measured at +100 mV (a) and cell area (b), observed after 15 min of hypotonic perfusion. The currents and cell area were measured in the myocytes from STZ-diabetic mice (STZ), and those from the mice pretreated with 3-OMG before STZ injection (3-OMG + STZ). In a, the density of VRAC current observed in cells from the mice treated with 3-OMG alone is also shown. **Significantly different with P < 0.01, according to one-way ANOVA with post-hoc test In b, the values are expressed as relative to those obtained 5 min after application of hypotonic solution. Dashed line in a and b indicates the control level derived from the data in Fig. 3e (filled circle) and Fig. 2c (filled circle), respectively. *Significantly different with P < 0.05 according to an unpaired t-test. Number in parentheses indicates number of cells examined
