Fig. 4.
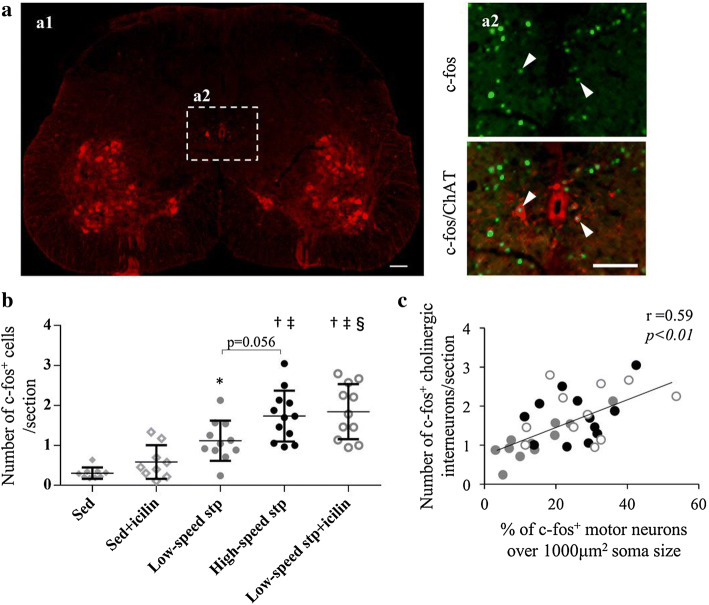
Treadmill stepping with icilin stimulation activates the cholinergic INs. Representative image of ChAT-immunostained spinal cord is shown (a1). Cholinergic INs near the central canal were identified in the range of 400 µm width and 300 µm length centering on the central canal (a2; box with white dashed line). Representative images of the c-fos+ cholinergic INs near the central canal (white arrowheads) immunostained with c-fos (green) and ChAT (red) are shown (a2; magnified in the right panels). Scale bar = 100 μm. The number of c-fos+ cholinergic INs near the central canal per section is shown for the sedentary, sedentary + icilin, low-speed stepping, high-speed stepping, and low-speed stepping + icilin groups (b). Each symbol represents an individual mouse. The horizontal lines indicate the mean values. Compared with the Sed group, *p < 0.05, †p < 0.01; compared with the Sed + icilin group, ‡p < 0.01; compared with low-speed stp group, §p < 0.05. Data are represented as the mean ± SD. The correlation between the activation of cholinergic INs and the activation of large MNs in all mice of the three stepping group (n = 34) is shown (c). Gray circles, black circles, and empty circles with gray outline indicate low-speed stepping, high-speed stepping, and low-speed stepping + icilin, respectively (color figure online)

