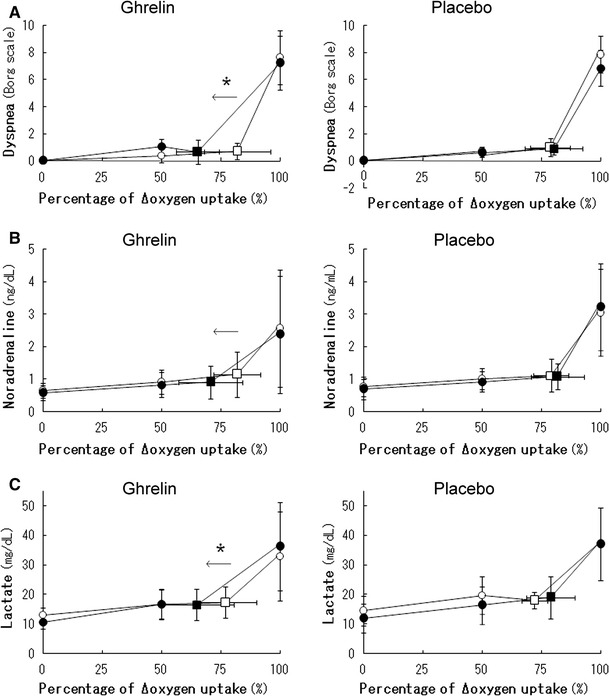
Fig. 3.

Cardiopulmonary data-ratios (%) from the Δ curves of COPD patients during pulmonary rehabilitation with ghrelin or placebo. Cardiopulmonary responses are plotted against the ratio (%) of Δ that occurs during exercise. Δ, increment in between resting and peak exercise; open symbols, pre-treatment values; solid symbols, post treatment values; square symbols, dyspnea, lactate, or noradrenaline break-point, with SD. Dyspnea, noradrenaline, and lactate break-points with ghrelin were determined for 9, 9, and 8 patients, respectively, and with placebo for 7, 7, and 6 patients, respectively. *P < 0.05, mean differences between pre-treatment and post-treatment were analyzed for the ghrelin and placebo groups by use of unpaired t tests. Treatment effect: mean difference from pre-treatment (ghrelin minus placebo)
