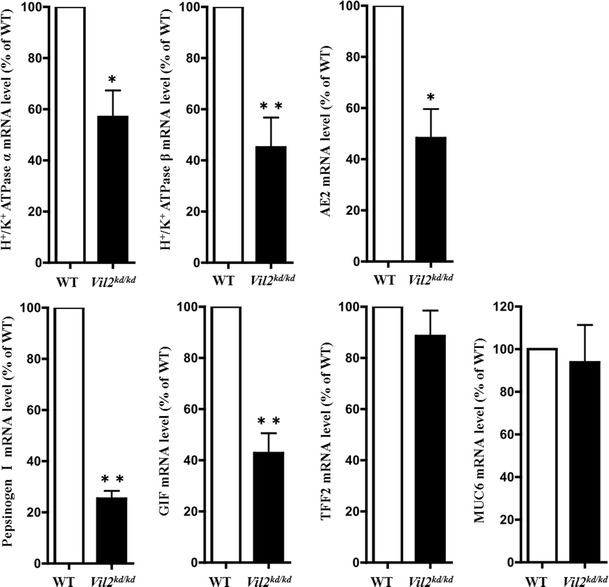
Fig. 5.

mRNA expression levels of gastric proton pump α and β subunits, AE2, pepsinogen I, GIF, TFF2, and MUC6 in the gastric corpus were compared between wild-type and Vil2 kd/kd mice. The mRNA expression levels were normalized to the level of expression of GAPDH, and values are shown as percentages of the expression levels in the wild-type. All values are mean ± SE, N = 3, for wild-type and Vil2 kd/kd mice. *P < 0.05 and **P < 0.01 versus wild-type
