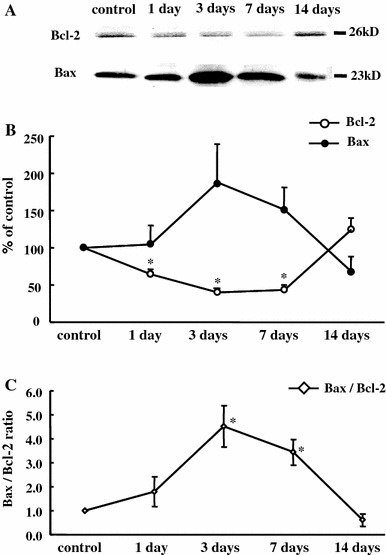
Fig. 5.

Immunoblot analysis of the protein expression of Bcl-2 and Bax. Inset displays representative images for control and ECC muscles (a). Quantification by densitometry of Bcl-2 protein was significantly decreased 1, 3, and 7 days after ECC compared with control (b). Values are expressed as the percentage of the mean values of the control. Bax/Bcl-2 ratio was significantly higher at 3 and 7 days after ECC (c). *p < 0.05, significant difference from control
