Fig. 5.

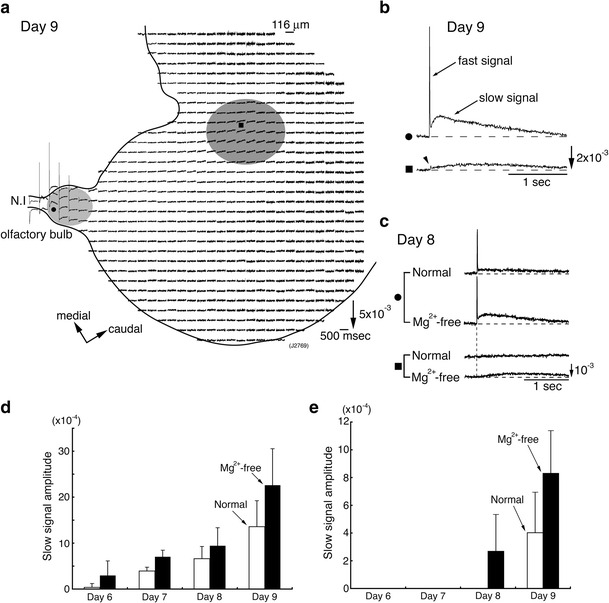
a Multiple-site optical recording of neural responses to N.I stimulation in a 9-day embryonic N.I-OB-forebrain preparation. In this recording, two response areas were identified: in the OB (shadowed in light gray), and in the forebrain (shadowed in dark gray). b Enlarged traces of the optical signals detected from the OB (upper trace marked by a black circle in a) and the forebrain (lower trace marked by a black square in a). In the lower trace, a small spike-like signal corresponding to the presynaptic action potential was identified (marked by an arrowhead). c Appearance of the slow signal in the forebrain of an 8-day chick embryo upon the removal of Mg2+ from the bathing solution. In the forebrain (marked by a black square), no slow signal was observed in normal solution, whereas a small slow signal was evoked in Mg2+-free solution. d, e Comparison of the slow signal amplitude in the OBs (d) and the forebrains (e) at 6- to 9-day embryonic stages. The slow signal amplitudes in normal (white bars) and Mg2+-free saline (black bars) are presented as the mean + SD in the fractional change. Modified from Ref. [10]
