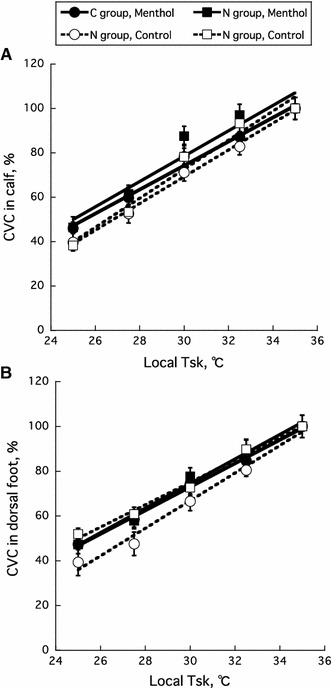
Fig. 2.

Relationships between local T sk and cutaneous vascular conductance (CVC) in the calf (a) and dorsal foot (b) of cold-sensitive (C) and normal (N) groups. Closed and open circles represent data for menthol and control conditions, respectively
