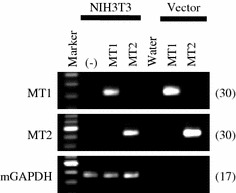
Fig. 3.

RT-PCR analysis of rat MT1 and MT2 mRNA expression in NIH3T3 cell lines stably transfected with pcDNA6.2-rat MT1 or pcDNA6.2-rat MT2. We performed RT-PCR to confirm the stable expression of rat MT1 and MT2 in transfected NIH3T3 cells. Expression of MT1 (upper panel), MT2 (middle panel), and mouse GAPDH (mGAPDH) (lower panel). “(–)” indicates samples prepared from untransfected NIH3T3 cells. 0.1 ng of pcDNA6.2-rat MT1 or pcDNA6.2-rat MT2 vectors were used as positive controls. The number on the right of each panel indicates the number of PCR cycles performed
