
Fig. 2.
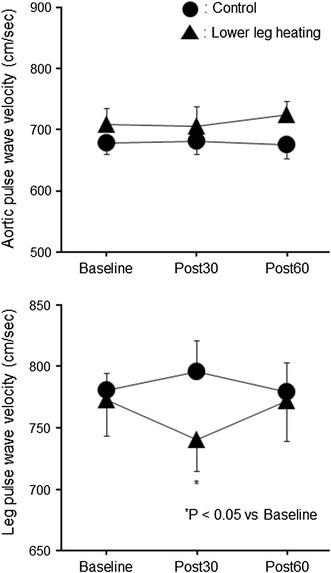
Responses of aortic (top) and leg (bottom) pulse wave velocity to the heating intervention. Data are given as the mean ± standard error of the mean (SEM). *P < 0.05 vs. baseline
Official websites use .gov
A
.gov website belongs to an official
government organization in the United States.
Secure .gov websites use HTTPS
A lock (
) or https:// means you've safely
connected to the .gov website. Share sensitive
information only on official, secure websites.
Responses of aortic (top) and leg (bottom) pulse wave velocity to the heating intervention. Data are given as the mean ± standard error of the mean (SEM). *P < 0.05 vs. baseline