
Fig. 3.
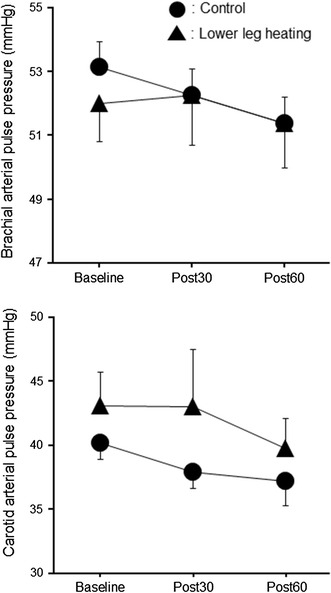
Responses of brachial (top) and carotid (bottom) arterial pulse pressure to the intervention. Data are reported as the mean ± SEM
Official websites use .gov
A
.gov website belongs to an official
government organization in the United States.
Secure .gov websites use HTTPS
A lock (
) or https:// means you've safely
connected to the .gov website. Share sensitive
information only on official, secure websites.
Responses of brachial (top) and carotid (bottom) arterial pulse pressure to the intervention. Data are reported as the mean ± SEM