Fig. 1.

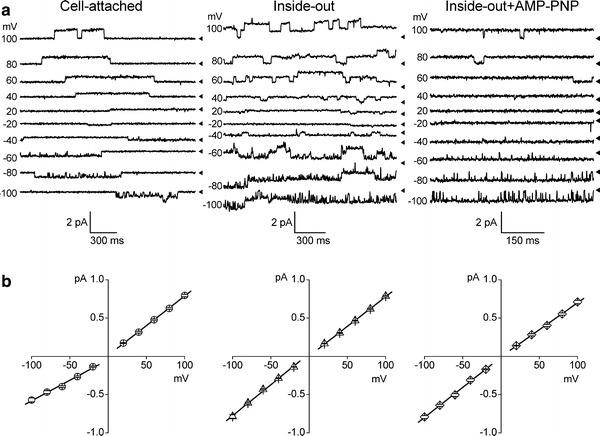
Single CFTR Cl− channel currents in the open and locked-open states recorded from HEK293T cells transiently transfected with CFTR gene. Representative current traces (a) and corresponding unitary current–voltage relationships (b) recorded from a cell-attached patch (left traces), inside-out patch (center traces) in the presence of 2 mM ATP and inside-out patch in the presence of 2 mM ATP + 5 mM AMP-PNP (right traces) in the bath (intracellular) solution with standard pipette solution at different membrane voltages as indicated on the left of each trace. Arrowheads on the right of each trace indicate zero current level. Each data point represents the mean ± SEM of 8–32 measurements from 5–7 different patches. Solid lines are linear fits with slopes corresponding to the unitary outward and inward conductances
