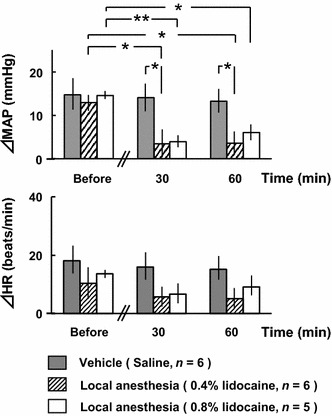
Fig. 5.

Comparisons of changes in mean arterial pressure (ΔMAP) and heart rate (ΔHR) in response to electrical stimulation of the bilateral masseter muscles before and after administration of local anesthesia to the bilateral upper and lower molar regions. *p < 0.05, **p < 0.01 (two-way ANOVA, followed by the Tukey–Kramer post hoc test)
