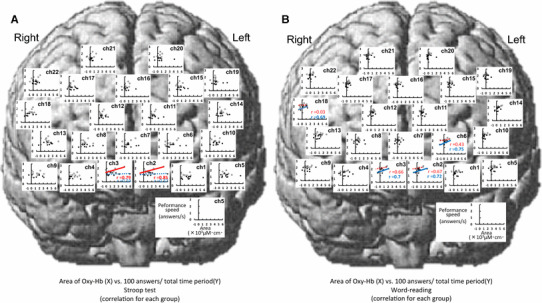
Fig. 10.

Relationships between the area under the curve [×103 (µM cm) s] of the Oxy-Hb response and cognitive performance speed (answers/s) during the Stroop test (a) and word-reading test (b) across the data consolidated in nine young (white circles) and nine elderly subjects (black circles)
