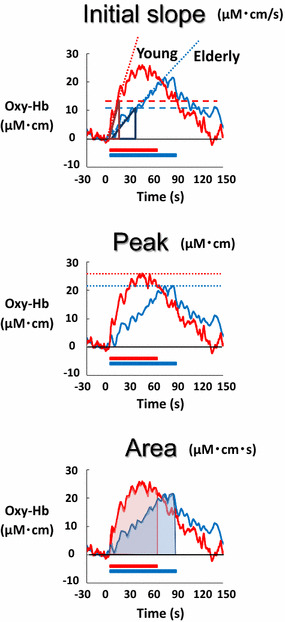
Fig. 2.

Definition of the initial slope, peak, and area under the curve of the Oxy-Hb response in a young (red line) and an elderly subject (blue line). The initial slope of the Oxy-Hb response was determined as an incremental rate obtained from calculating a ratio between the 50% of the peak Oxy-Hb response and the time at which the Oxy-Hb reached the 50% level. The peak component of the Oxy-Hb response was defined as the greatest change during the cognitive test from the baseline value. The area under the curve of the Oxy-Hb response was defined as a product between the average Oxy-Hb response and the duration of the test
