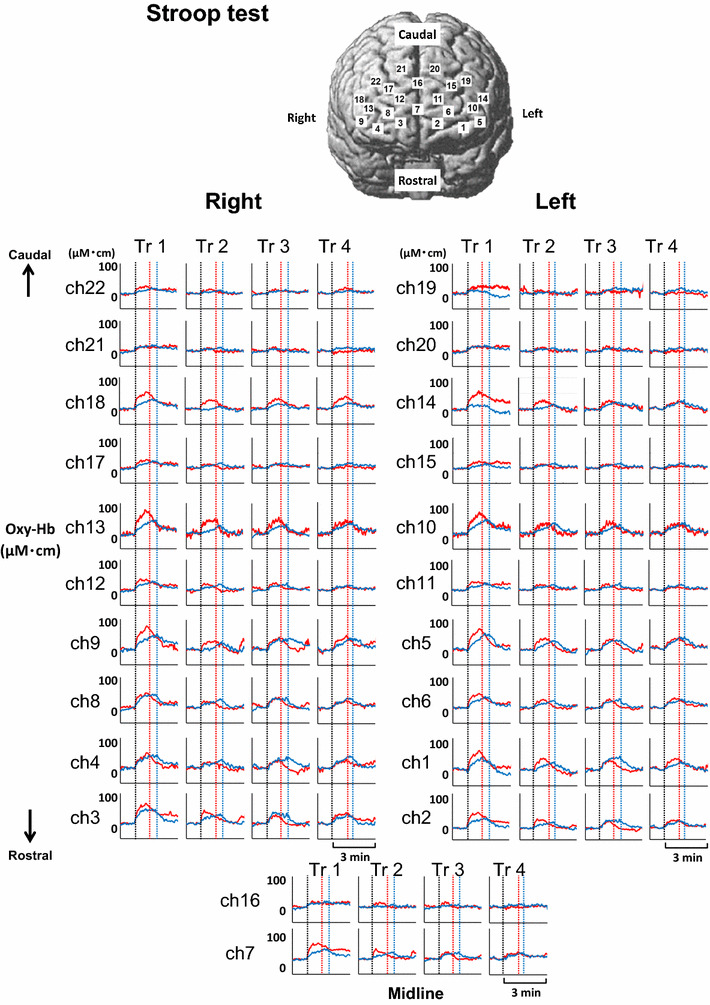
Fig. 3.

Time courses of the average Oxy-Hb responses in four repetitive trials of the Stroop test are represented at 22 various sites of bilateral prefrontal cortices in nine young (red line) and nine elderly subjects (blue line). Vertical dotted lines indicate the start and end of the Stroop test in both age groups
