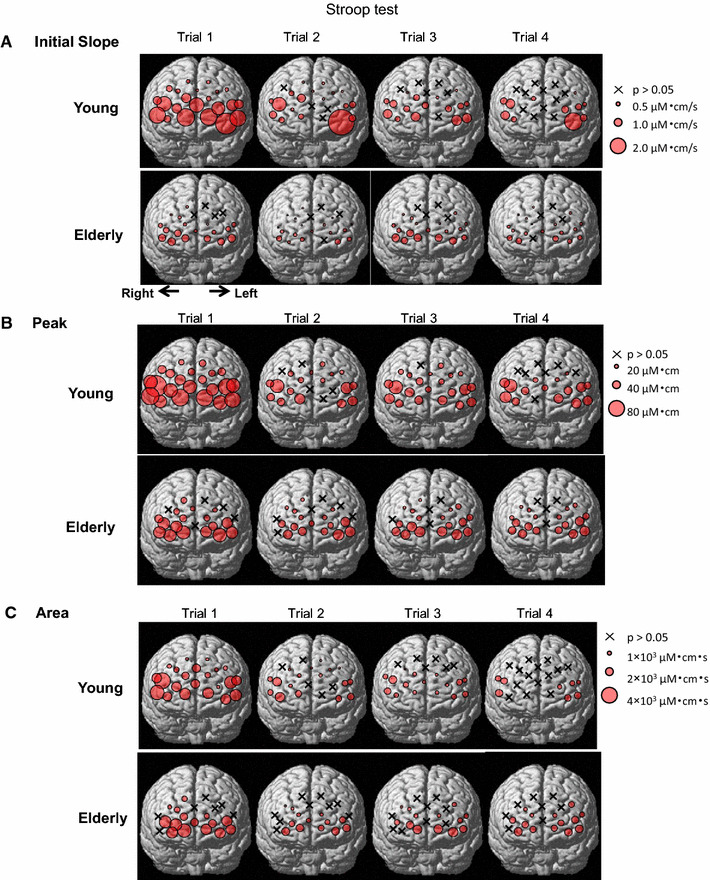
Fig. 4.

Spatial distributions of the three components [initial slope (a), peak (b), and area under the curve (c)] of the Oxy-Hb response during the Stroop test in nine young and nine elderly subjects. Each circle indicates a significant difference (P < 0.05) from the baseline before the Stroop test. An x indicates no significant difference (P > 0.05) from the baseline. The diameter of each circle is illustrated in proportion to the response magnitude
