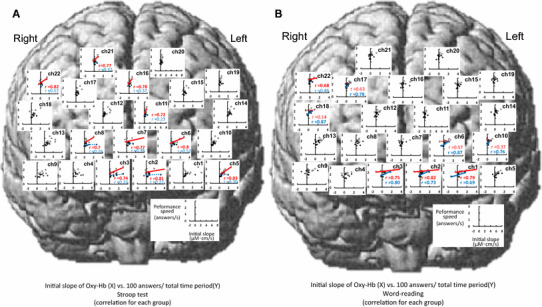
Fig. 8.

Relationships between the initial slope [(µM cm)/s] of the Oxy-Hb response and cognitive performance speed (answers/s) during the Stroop test (a) and word-reading test (b) across the data consolidated in nine young (white circles) and nine elderly subjects (black circles). If a significant correlation (P < 0.05) is obtained, a solid linear regression line is inserted (red, young, blue, elderly). The correlation coefficients (γ) by a Pearson’s method are inserted in all significant comparisons. The dotted red or blue line was presented, for comparison between young and elderly subjects, in the channels with no significant correlations. The rule of data presentation in Figs. 9 and 10 is the same as this figure
