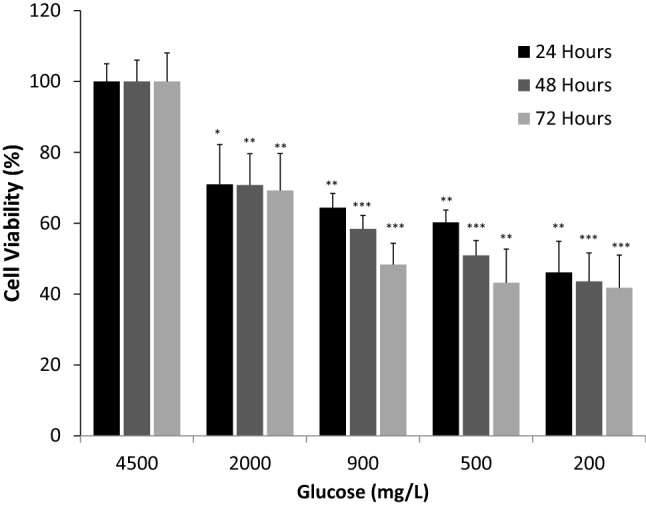
Fig. 1.

Viability of hypothalamic neurons after exposure to various concentration of glucose. Concentrations of glucose (mg/L) were 4500, 2000, 900, 500 and 200 and the duration of exposure was 24, 48, and 72 h. Data are presented as the mean ± SD (n = 6, *P < 0.05; **P < 0.01, ***P < 0.001, compared to normoglycemia condition of4500 mg/L glucose)
