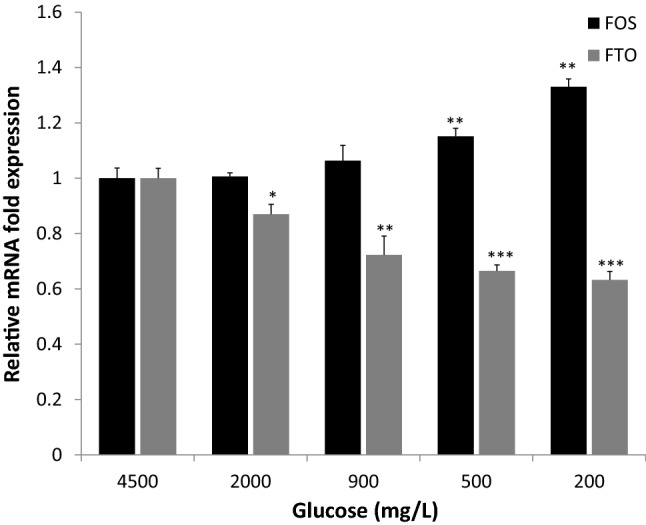
Fig. 3.

Expression of FOS and FTO mRNA transcripts in the embryonic hypothalamic neurons. Fold difference in FOS (Black Bars) and FTO (Gray Bars) mRNA levels in response to low glucose conditions (2000, 900, 500 and 200 mg/L) was compared with mRNA levels under normoglycemic condition (4500 mg/L) as the reference = 1, as determined by quantitative reverse transcription-polymerase chain reaction. Error bars represent the standard deviations (n = 3, *P < 0.05, **P < 0.01, ***P < 0.001)
