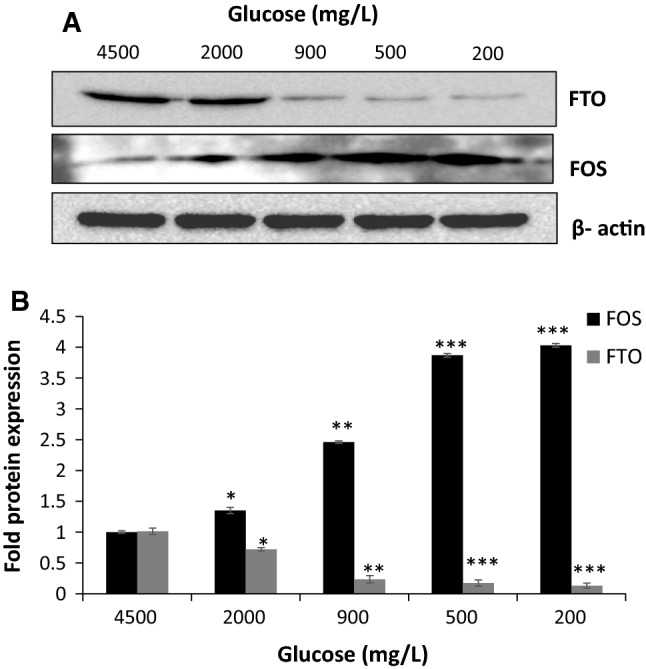
Fig. 4.

Quantitation of Western blot FOS and FTO protein expression in response to low glucose conditions. a Representative Western blot of FOS and FTO in response to different glucose conditions (2000, 900, 500 and 200 mg/L). b Protein levels of FOS (Black Bars) and FTO (Gray Bars) were corrected to actin expression (*P < 0.05; **P < 0.01, ***P < 0.001)
