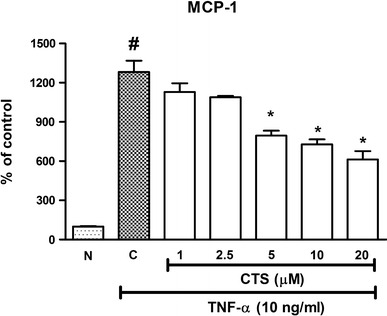
Fig. 4.

Effect of CTS on TNF-α-induced increase in MCP-1 levels in HUVECs. CTS was concurrently incubated with TNF-α for 6 h. N non-induced, C control. Values are expressed as the mean ± SEM from three independent experiments. Hash (#) indicates significant difference from the non-induced group, p < 0.05. Asterisk (*) indicates significant difference from the control, p < 0.05
