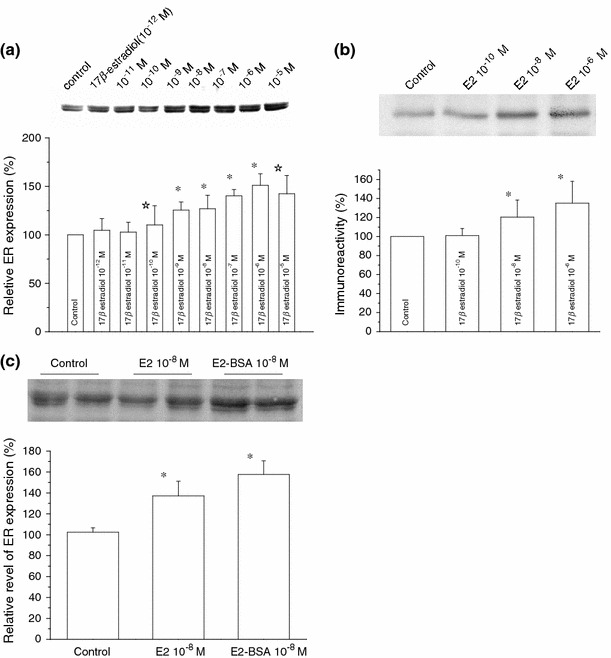
Fig. 3.

Dose–dependent effects of 17β-estradiol on the expression of total and nonnuclear ER. Representative immunoreactive bands for total ER in C2C12 myoblasts (upper panel) and the relative expression of total ER protein (a) or nonnuclear ER protein (b) quantified by densitometric analysis (lower panel); after treatment with either vehicle (control), different concentrations of 17β-estradiol (10−12–10−5 M) in a and (10−10–10−6 M) in b for 15 h. c Shows the relative expression of total ER protein after treatment with vehicle (control), 17β-estradiol (10−8 M), and BSA-conjugated E2 (10−8 M) for 15 h. Each bar is normalized to the control (far left) and expressed as %. Columns and bars indicate mean ± SE (n = 3 in a, n = 4 in b, and n = 5 in c). *P < 0.01, ☆ P < 0.05 compared with control values, determined using Student’s t test
